By reading this tutorial you will learn what JSON data transform is and how to transform JSON data and use it.
So, you need to sort your JSON data by the time of the last update to see if it still contains recent updates. Or you need to verify how many users there are per city. Or you have to figure out how many different types of products there are ordered. Or you need to calculate the average price of all orders of last month to see if that is on par with the previous period.
When you’re a software developer, you regularly work with JSON data. Sometimes you have to inspect data and get some specific information out of it. There are various kinds of tools that can help work with JSON data, such as a command line tool like jq. In this tutorial we focus on using the visual tool provided by JSON Editor Online to query your JSON data. You can load your data in the editor, open the Transform modal. With a few clicks you can filter, sort, or pick fields out of the data by selecting the data fields from a dropdown.
Loading the data
In this article we’ll explore transforming JSON data, and we will use the following data set. It is a JSON array containing JSON objects. Every object holds information of a friend, containing their name, age, and the city where they live.
[
  { "name": "Chris", "age": 23, "city": "New York" },
  { "name": "Emily", "age": 19, "city": "Atlanta" },
  { "name": "Joe", "age": 32, "city": "New York" },
  { "name": "Kevin", "age": 19, "city": "Atlanta" },
  { "name": "Michelle", "age": 27, "city": "Los Angeles" },
  { "name": "Robert", "age": 45, "city": "Manhattan" },
  { "name": "Sarah", "age": 31, "city": "New York" }
]
You can open this data set in JSON Editor Online by clicking the button below. I recommend trying out the examples for yourself. You can open this article and the editor side by side and try everything out whilst reading.
Open the data in JSON Editor Online
Once you’ve loaded the data set in the editor, it will look like:
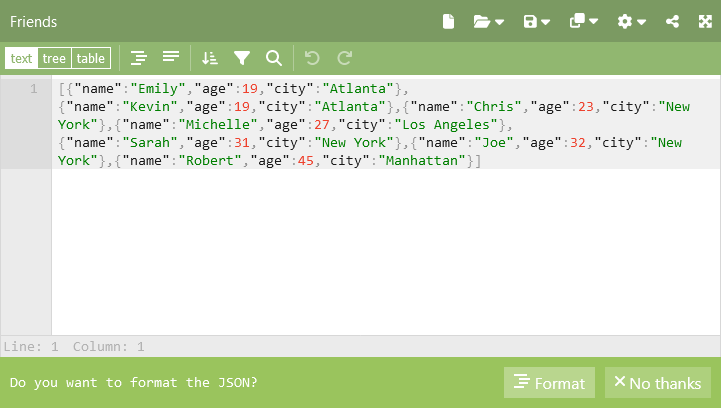
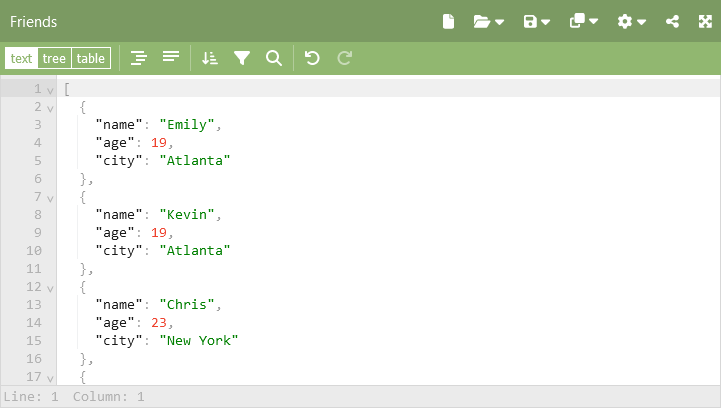
This is a bit hard to read because it is compact and does not have indentation. Let’s follow the hint of the editor asking if we want to format the data by clicking the “Format” button at the bottom or from the menu.
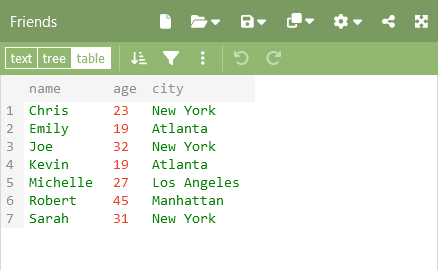
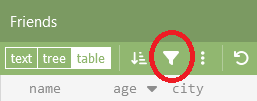
This list with objects is perfectly suitable for the table view. Click the “table” mode of the toggle top left. This gives a more concise view of the data, it looks a bit like an Excel table.
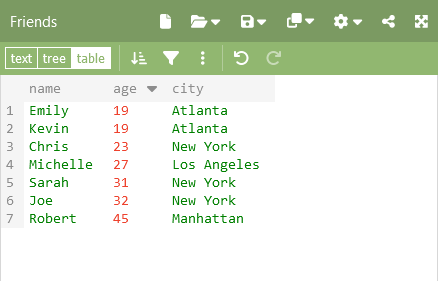
In the table view, you can sort a column by simply clicking the column name. Let us sort our friends by age:
But we want more than just sorting the data. It is time to open the Transform modal and see what we can do with it.
Opening the transform modal
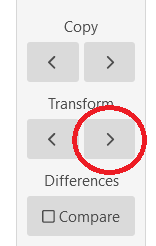
To do more advanced queries on our data, open the Transform modal. You can do this in two ways. The first is to use the Transform button in the menu of the editor. This will replace the content of the editor with the query results.
Alternatively, you can click the Transform button between the two panels. This will take the data from the editor in the left panel, and put the query results in the editor in the right panel. This will thus leave the original data unchanged.
The Transform modal that opens looks as follows. On the left side you see a wizard that can help you build up a query, and below the wizard there is a text area showing the actual query. On the right side you see the original data on top (the input), and a preview of the transformed data at the bottom (the output).
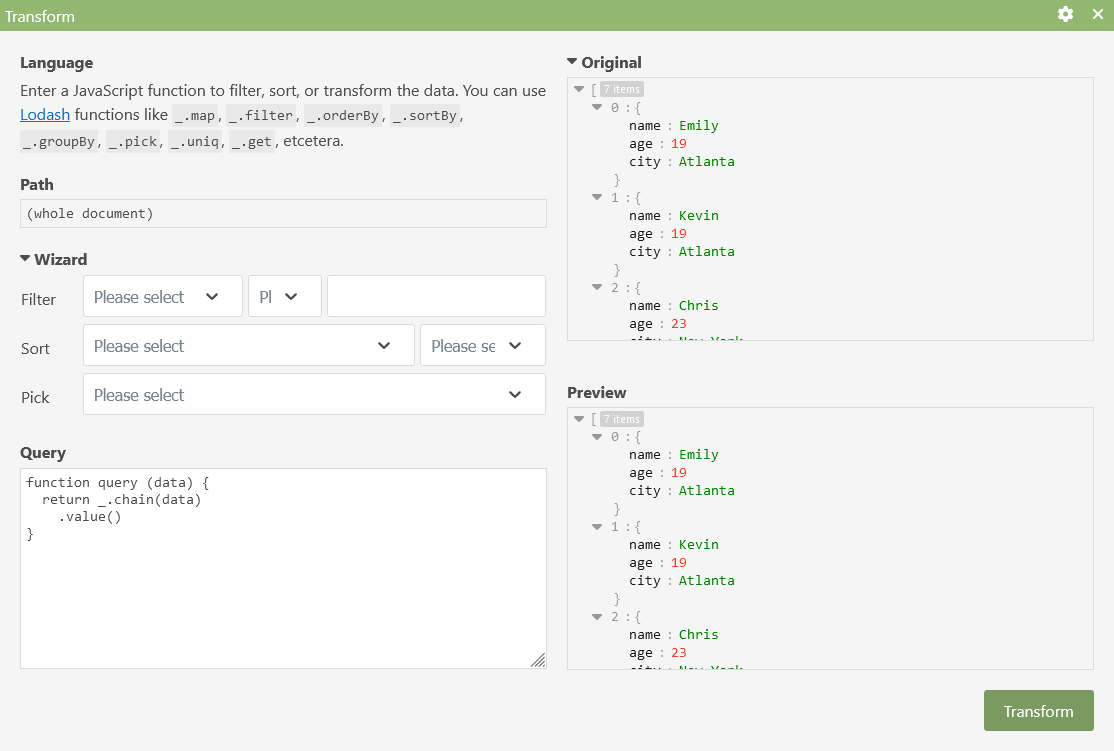
In this tutorial, we will use the Lodash query language. You can switch to JMESPath via the options menu top right, but we will not use that in this article.
The query wizard is helpful for the most common operations: filtering, sorting, or picking some fields out of the data. The dropdowns are automatically populated with the fields that exist in your data. The actual query is rendered in the text area bottom left, and can be edited manually to write more advanced queries as we will see later on.
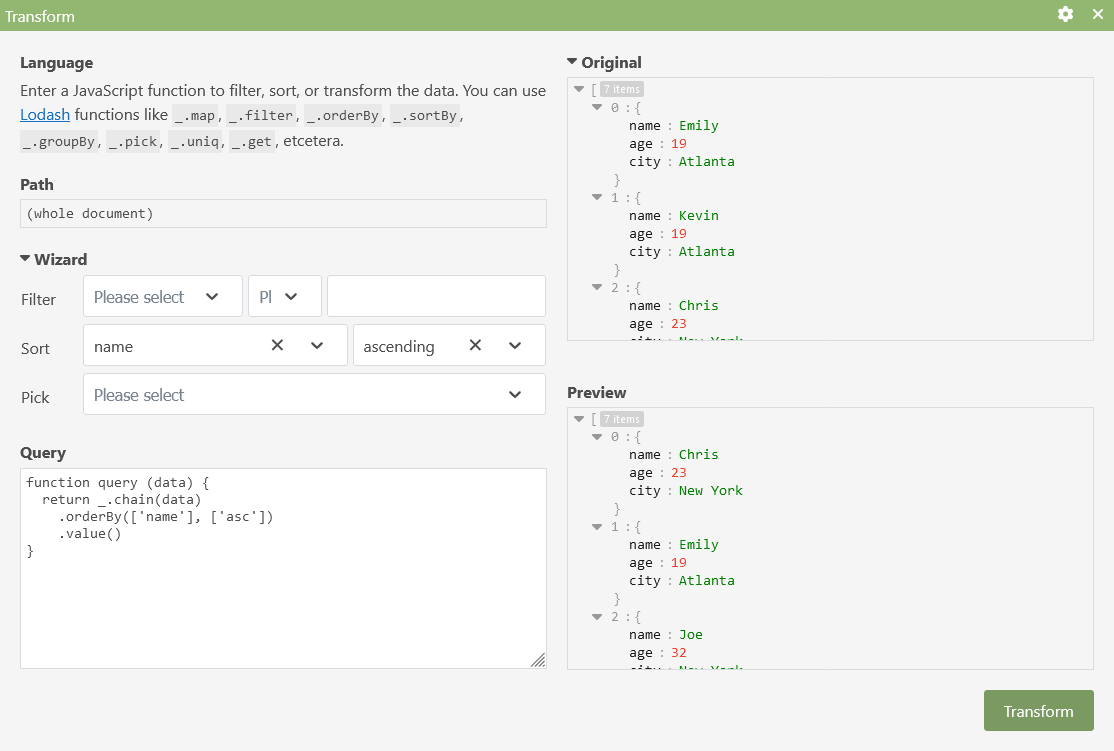
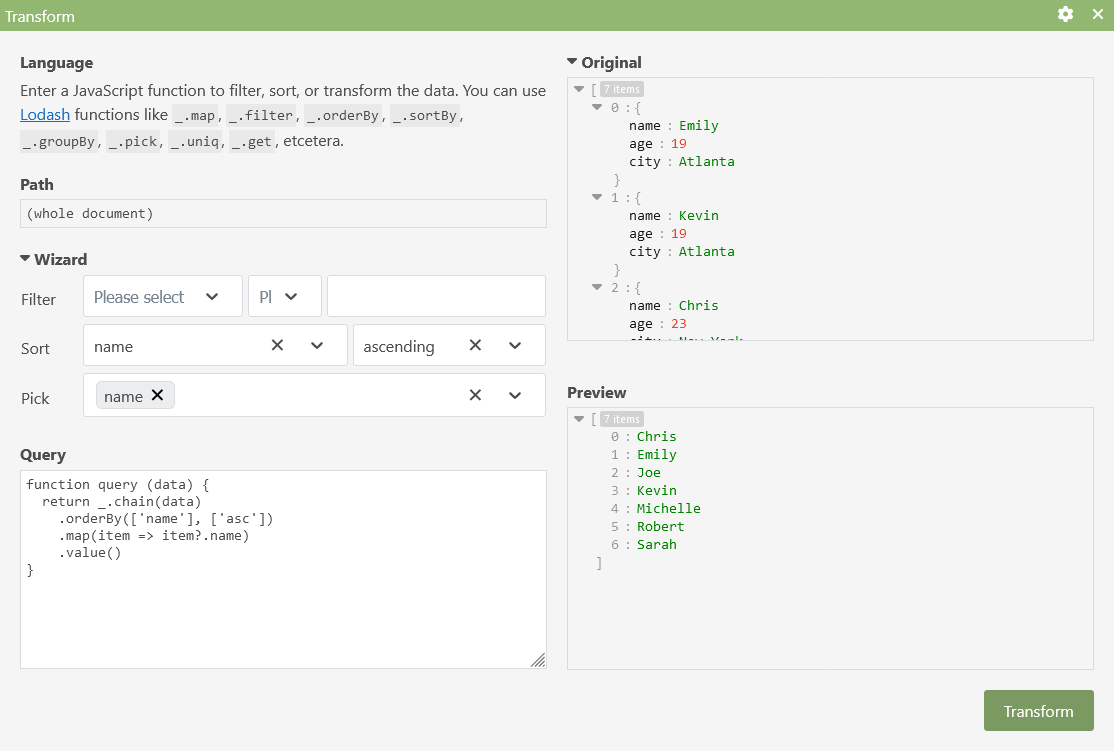
Sorting the data
Time for action. Let us sort the users by their name. In the dropdowns for “Sort”, select “name” and “ascending”. The query at the bottom right will be updated automatically. In the “Preview” at the bottom right, you will see the sorted data.
Picking some fields out of the data
Let us now pick only the name fields out of the data. In the dropdown “Pick”, select “name”. The output now is a list with JSON values containing the names of your friends sorted by name. Notice that you can pick multiple fields if you want. Basically, picking some fields out of a nested JSON object allows you to change the structure of your data.
Filtering the data
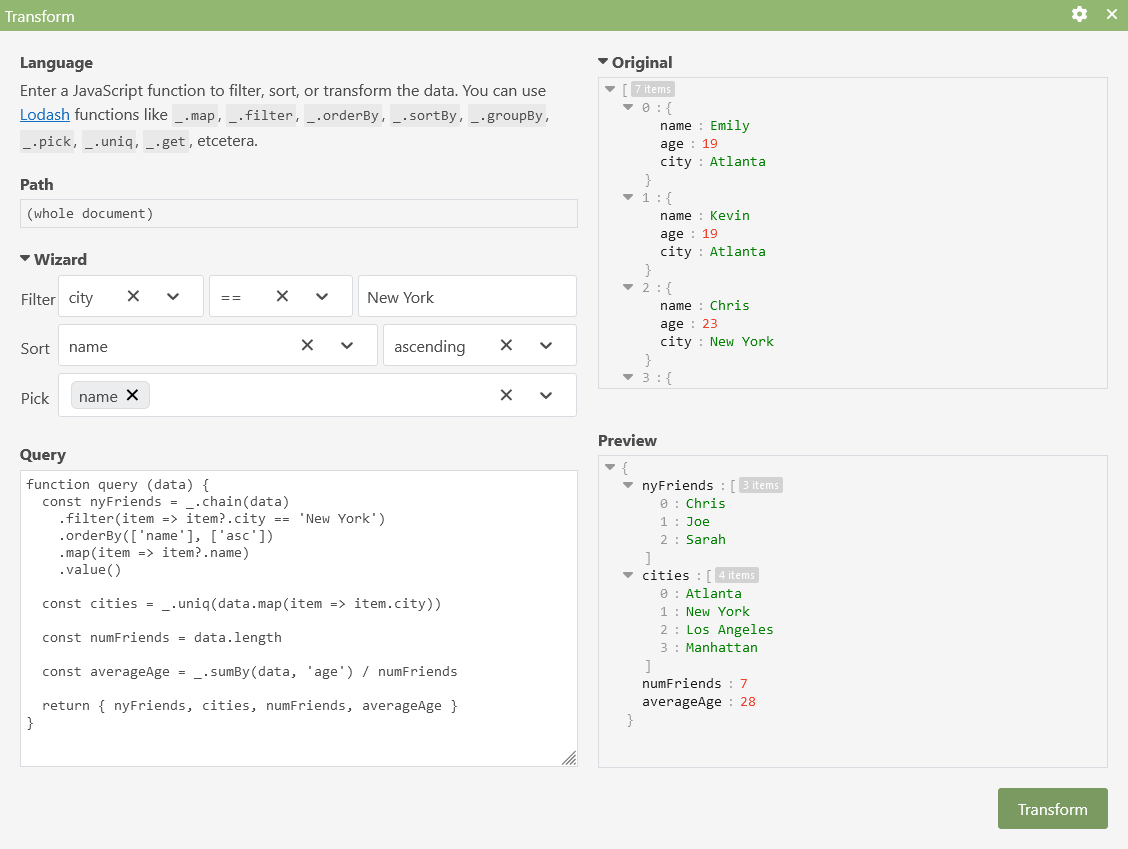
We’ll visit New York next week, so let’s filter all friends that live in New York, so we can drop by. In the “Filter” dropdown, select “city”, ”==”, and enter “New York” as value (the casing is important). The result now only shows three friends out of the seven.

A more advanced query
Let us now try out manually writing a more advanced query. If you’re familiar with JavaScript and Lodash, this will be very easy to do. If you’re not familiar, you can do some reading up on the website of Lodash, or just continue with this tutorial to get a bit of an idea. Lodash is a collection of powerful functions to map, filter, sort, and group data.
Let us collect and output multiple query results. First, we will collect the list with our friends from New York in a variable:
const nyFriends = _.chain(data)
  .filter((item) => item?.city === 'New York')
  .orderBy(['name'], ['asc'])
  .map((item) => item?.name)
  .value()
Then, let us use the Lodash function uniq to get the different cities where our friends live, so we have an overview of all cities that we may want to visit.
const cities = _.uniq(data.map((item) => item.city))And last, just for fun, let us calculate the average age of all our friends by calculating the sum of all ages and dividing this by the number of friends:
const numFriends = data.length
const averageAge = _.sumBy(data, 'age') / numFriends
Putting all of this together and returning the results from the query looks like:
function query(data) {
  const nyFriends = _.chain(data)
    .filter((item) => item?.city == 'New York')
    .orderBy(['name'], ['asc'])
    .map((item) => item?.name)
    .value()

  const cities = _.uniq(data.map((item) => item.city))

  const numFriends = data.length

  const averageAge = _.sumBy(data, 'age') / numFriends

  return { nyFriends, cities, numFriends, averageAge }
}
The preview now shows our result:
{
  "nyFriends": ["Chris", "Joe", "Sarah"],
  "cities": ["Atlanta", "New York", "Los Angeles", "Manhattan"],
  "numFriends": 7,
  "averageAge": 28
}
The Transform modal will now look as follows:
Once you’re done writing your query, you can click the “Transform” button bottom right to actually apply the query to your data.
Challenge: group the data
Time to try something out yourself. Create an overview that shows you which friends you can visit in any city where you have friends. Can you group the friends per city using the Lodash groupBy function? The result should look like:
{
  "New York": [
    { "name": "Chris", "age": 23, "city": "New York" },
    { "name": "Joe", "age": 32, "city": "New York" },
    { "name": "Sarah", "age": 31, "city": "New York" }
  ],
  "Atlanta": [
    { "name": "Emily", "age": 19, "city": "Atlanta" },
    { "name": "Kevin", "age": 19, "city": "Atlanta" }
  ],
  "Los Angeles": [{ "name": "Michelle", "age": 27, "city": "Los Angeles" }],
  "Manhattan": [{ "name": "Robert", "age": 40, "city": "Manhattan" }]
}
Have fun 🙂
Conclusion about transform JSON data
JSON Editor Online comes with a powerful tool to query JSON data. By using JavaScript code and Lodash as a query language, you can write extremely flexible queries and can do any kind of data transformation. The wizard allows you to select fields out of your data with a single click, making it a breeze to quickly filter or sort your data. There is a visual preview, so you can directly see if your query does what you want it to do before executing it for real.